The World: flat on a small scale, round on a large
Whatever your business object is (the “patient”, the “produced part”, the “machine”, or the “customer”, etc.) – you are constantly collecting diverse information about it. And this much is certain: this diversity of information will even expand in the future. Therefore, it is becoming increasingly important that you can analyze your business object across all the diverse data streams related to it.
Collecting and consistently managing complex data – that’s what relational databases are great at and created for. However, to do this, you have to break an object down into its component parts and store them in different – flat – tables. Once an object is spread across many tables, it is challenging to analyze it “as a whole” – and an agile 360° view is hard to achieve.
To enter new horizons and move beyond flat data structures, we need technologies that can handle the complexity and volume of real-world data (RWD): Xplain Data ObjectAnalytics.
What that means for you
Typical sub-objects for your root business object are:
- HealthCare: event streams such as the prescriptions, diagnoses, and procedures along the lifetime of the patient
- Manufacturing: production data with thousands of workpieces and the associated millions of process parameters, events, environmental conditions and messages etc. along a production line
Easily answer questions relating to the various sub-streams, e.g.
- medications used according to a particular diagnosis
- sequence of repair operations in relation to observed error messages
And ultimately, ObjectAnalytics is the foundation for Causal Discovery. Feature engineering becomes obsolete – you don’t build features for a specific problem – you simply work with an object as a whole.
ObjectAnalytics is moving from rows in a flat table to working with entire objects. Rethinking the world of statistics to deal with whole objects will push the field of machine learning and artificial intelligence into new dimensions.
Mandatory for holistic Analysis: 360° view provided by Xplain Data ObjectAnalytics
ObjectAnalytics is exactly the reverse of a relational database. All information about your business object is hooked into an object-centric data structure. This means that, for example, all information about each individual patient is available collectively in one “object instance”. What belongs together is stored together – and is available at your fingertips for holistic analyses.
With this object-centric representation, complex queries that analyze relationships between different sub-objects can be executed with high performance. Algorithms that were previously tedious to implement are now easy to apply. Novel algorithms – unimaginable before – become feasible (see CausalDiscoverer).
You may pull data from multiple sources and attach them as sub-objects (or recursive sub-objects), combining enterprise data from various origins into a single holistic picture. ObjectAnalytics does not replace your relational databases. It just quickly aggregates data from potentially disparate sources into one object-centric view, allowing you to work with your business objects “as a whole”.
What it looks like in practice
Some of our larger installations in the healthcare space hold 60 million patients and 3 billion events in different sub-objects (in some projects, up to 50 nested sub-objects) on a server with 128 cores. For each request, all cores will work in parallel, enabling us to serve numerous clients simultaneously.
The standard installation operates via a Docker container. Deploying our technology on a cloud platform such as AWS or just locally on your machine is extremely simple. The data scientist may use it as his local playground, and from there seamlessly turn proven solutions into a valuable enterprise deployment.
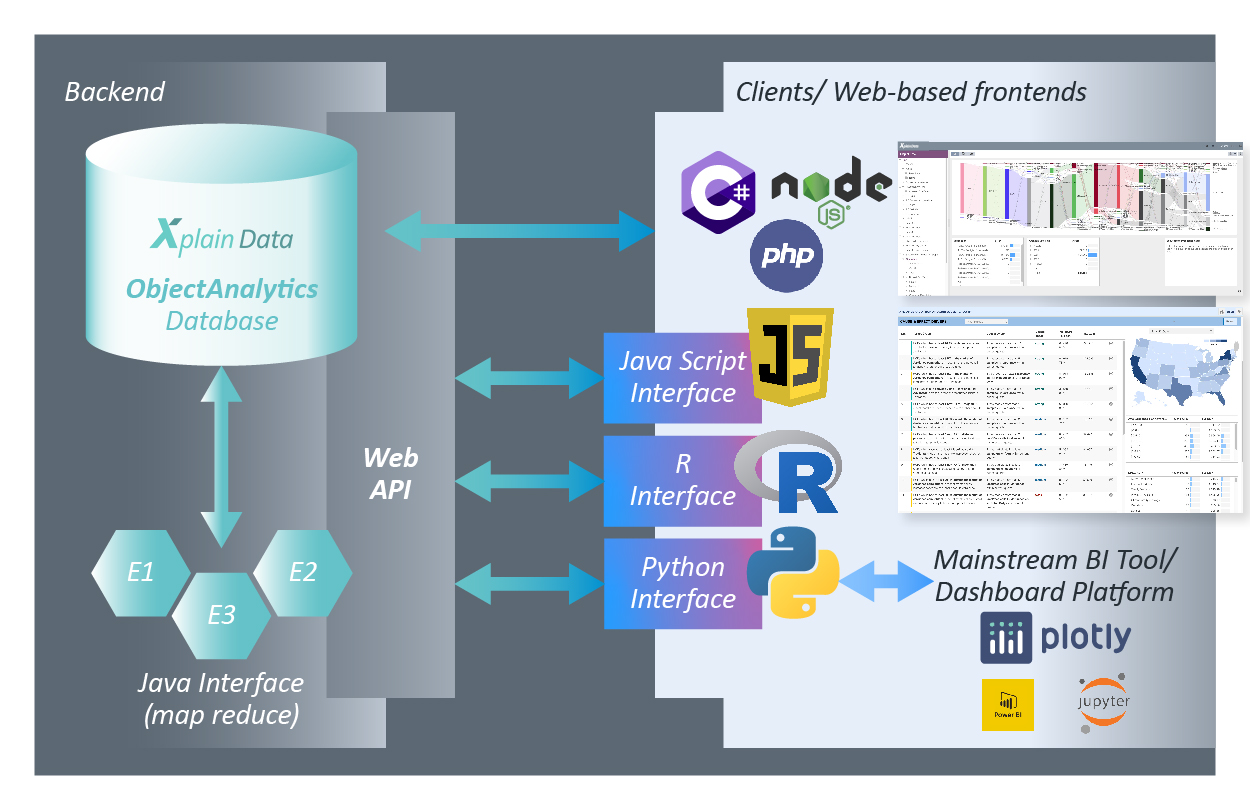
Interfaces
You can issue queries to the ObjectAnalytics Database from within any programming language which is able to initiate web requests.
In addition to the web interface, we offer:
- an extra layer of convenience that makes it easier to run queries and get back results
- a Java Object MapReduce interface to define an operation on an object and run this operation massively parallel on millions of stored object instances. You can inject algorithms deeply into the core engine of the database: the algorithms come to the data rather than needing to bring huge amounts of data to the algorithms.
The open interfaces offer a wide range of possibilities: Build your own custom application using the available interfaces – JavaScript, for example. Or use Dash Enterprise for dashboarding via the Python interface.
Availability
There are packages available for Python, R (beta), and JavaScript. Python and R primarily serve data scientists, while the JavaScript interface allows web developers to quickly implement an individual analytics application.
Note: The Java Object MapReduce interface has still not been officially released – please consult the Xplain Data team if you would like to use it.